Visual Services
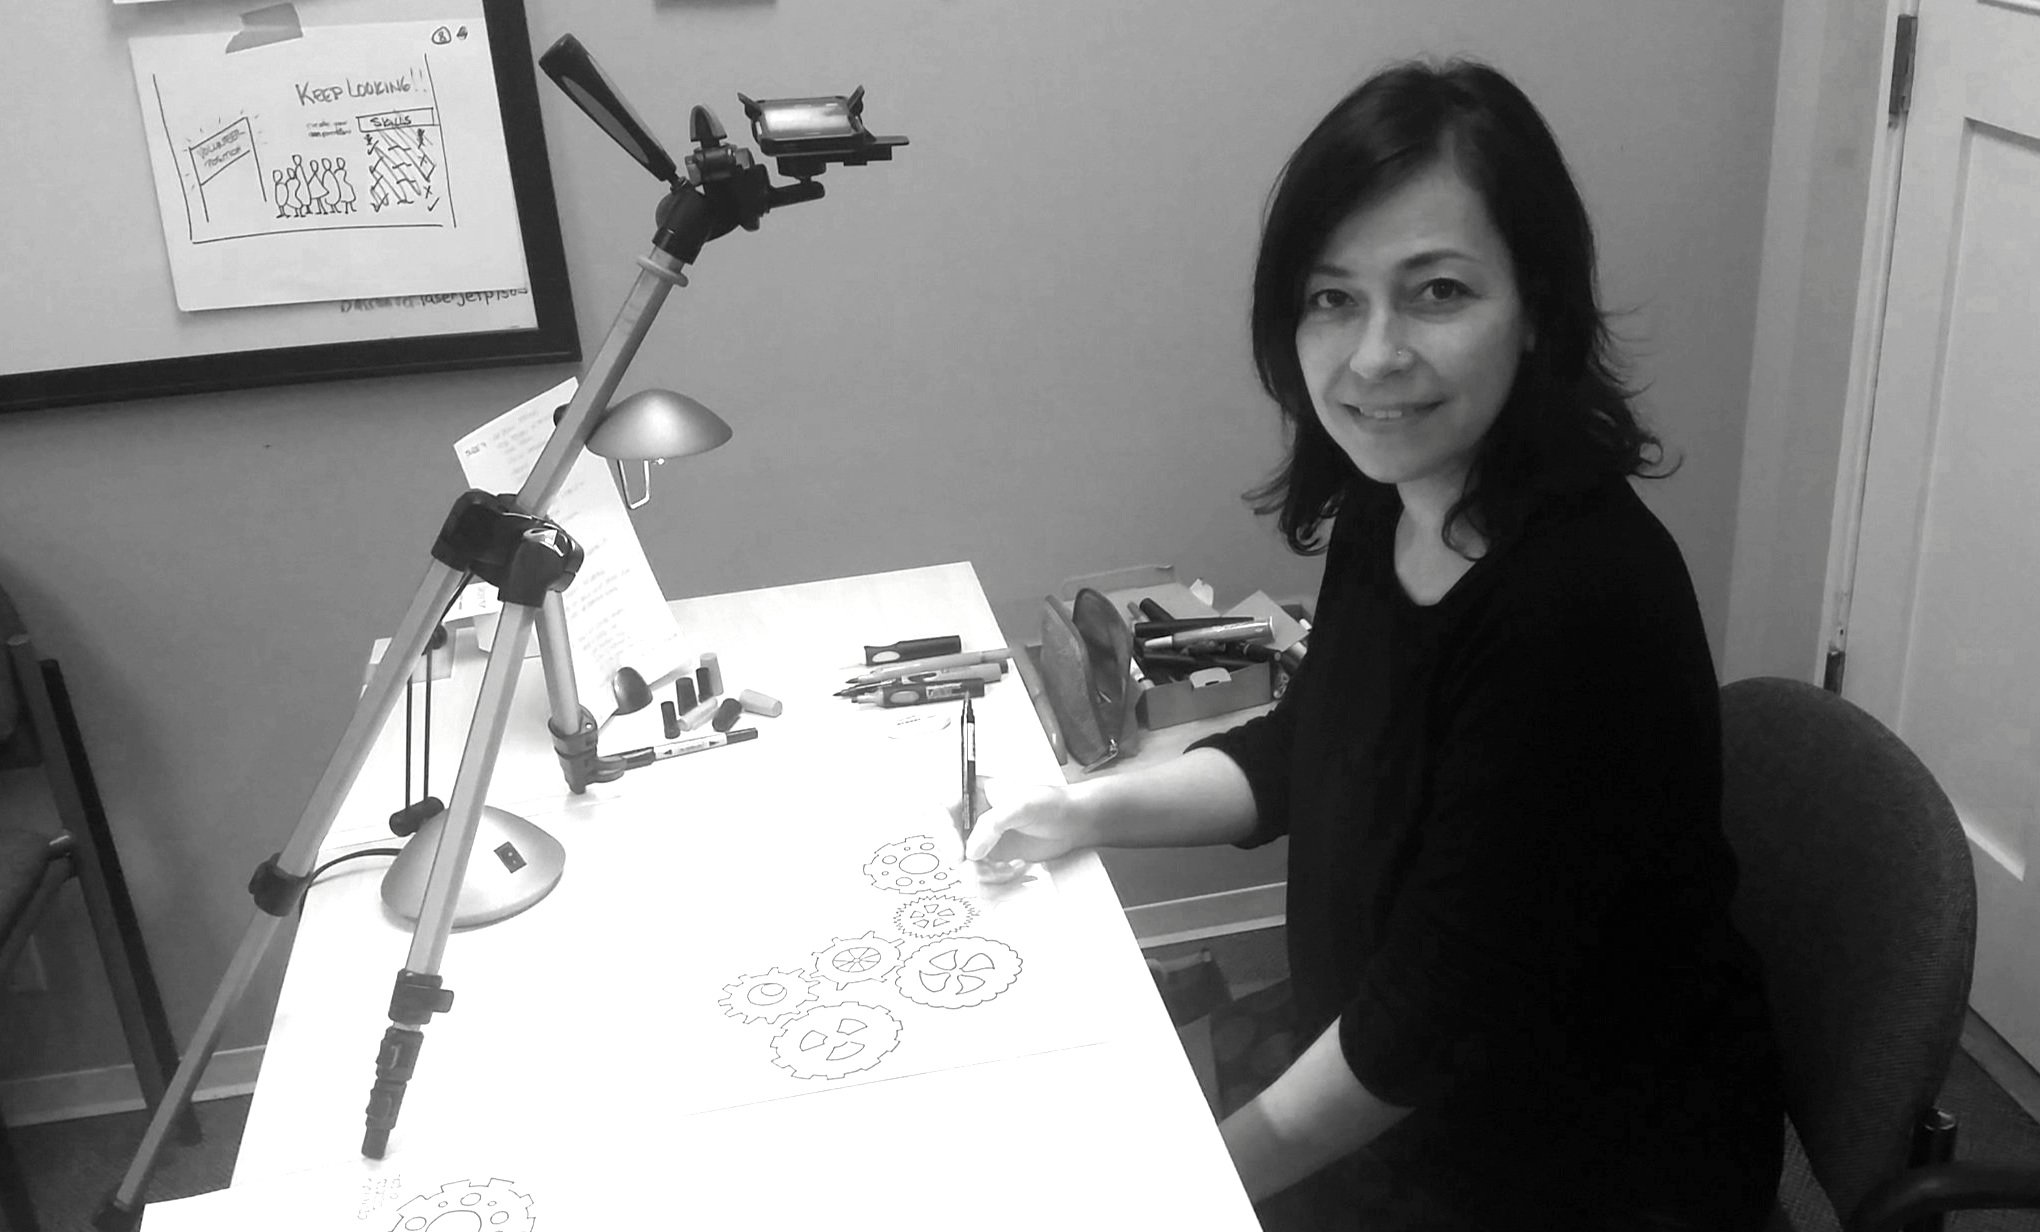
Bright Light Ideas adds excitement to your ideas and information through the power of visuals. It is no secret that visuals are more powerful than text in communicating ideas. Research shows that our brain processes images 60,000 times faster than text.
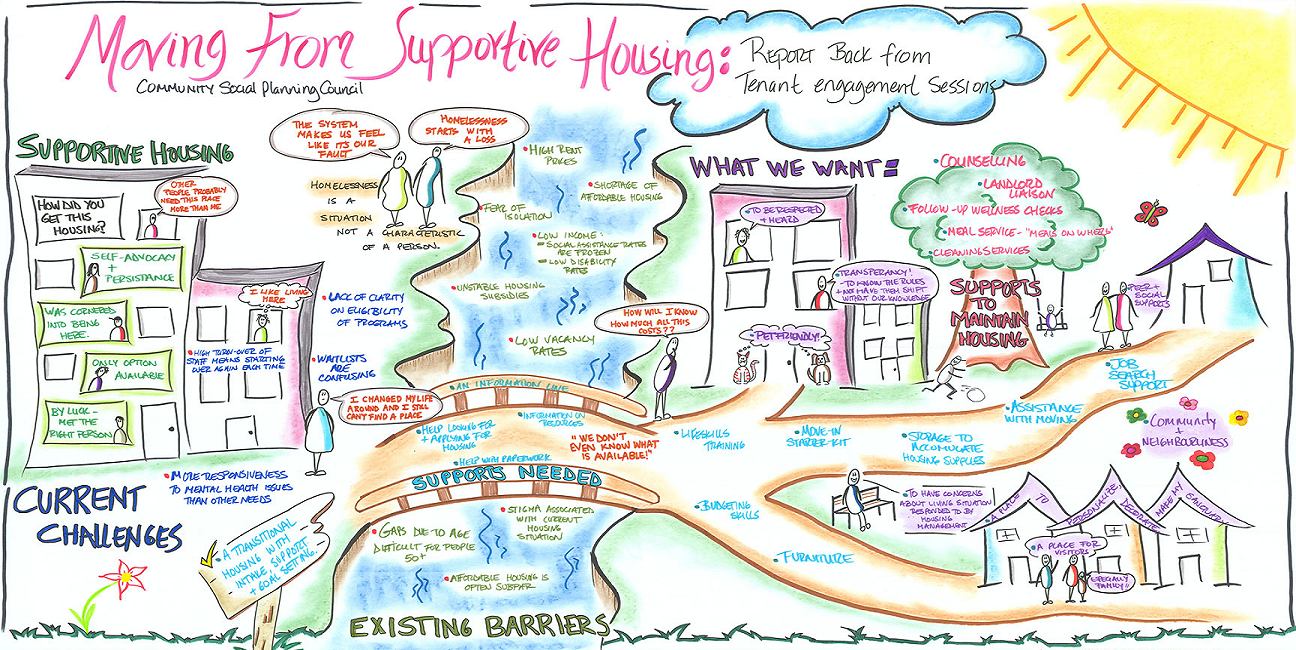
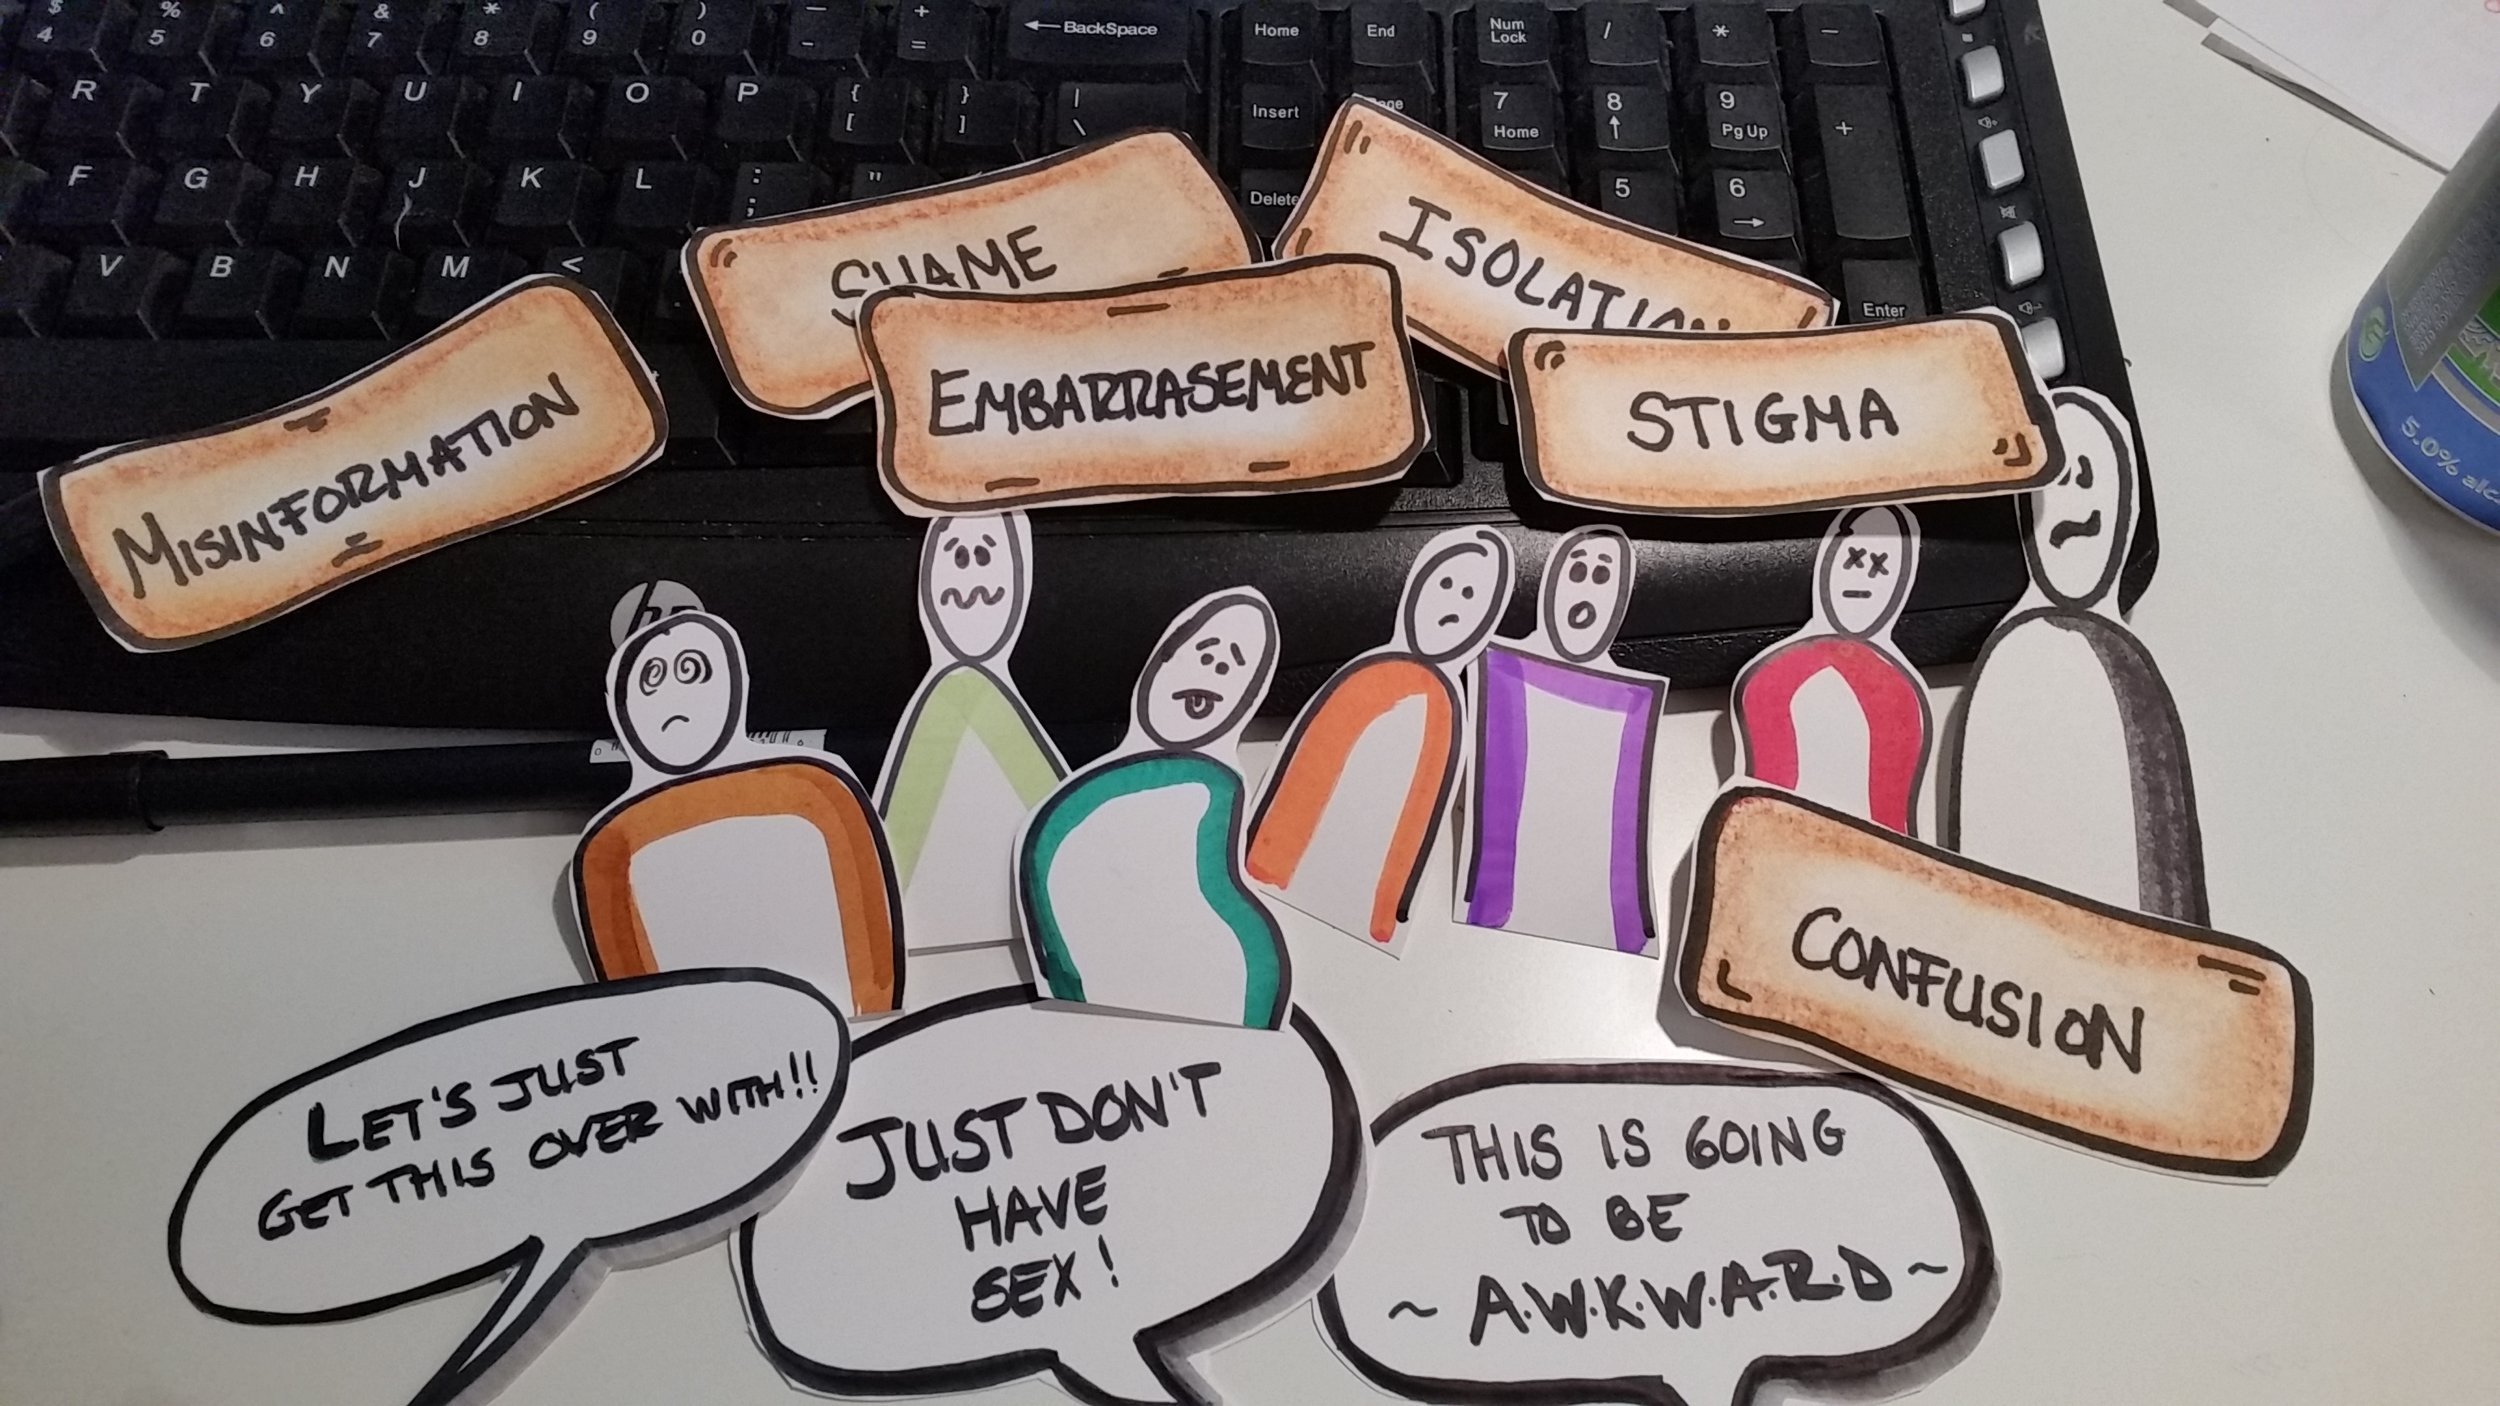
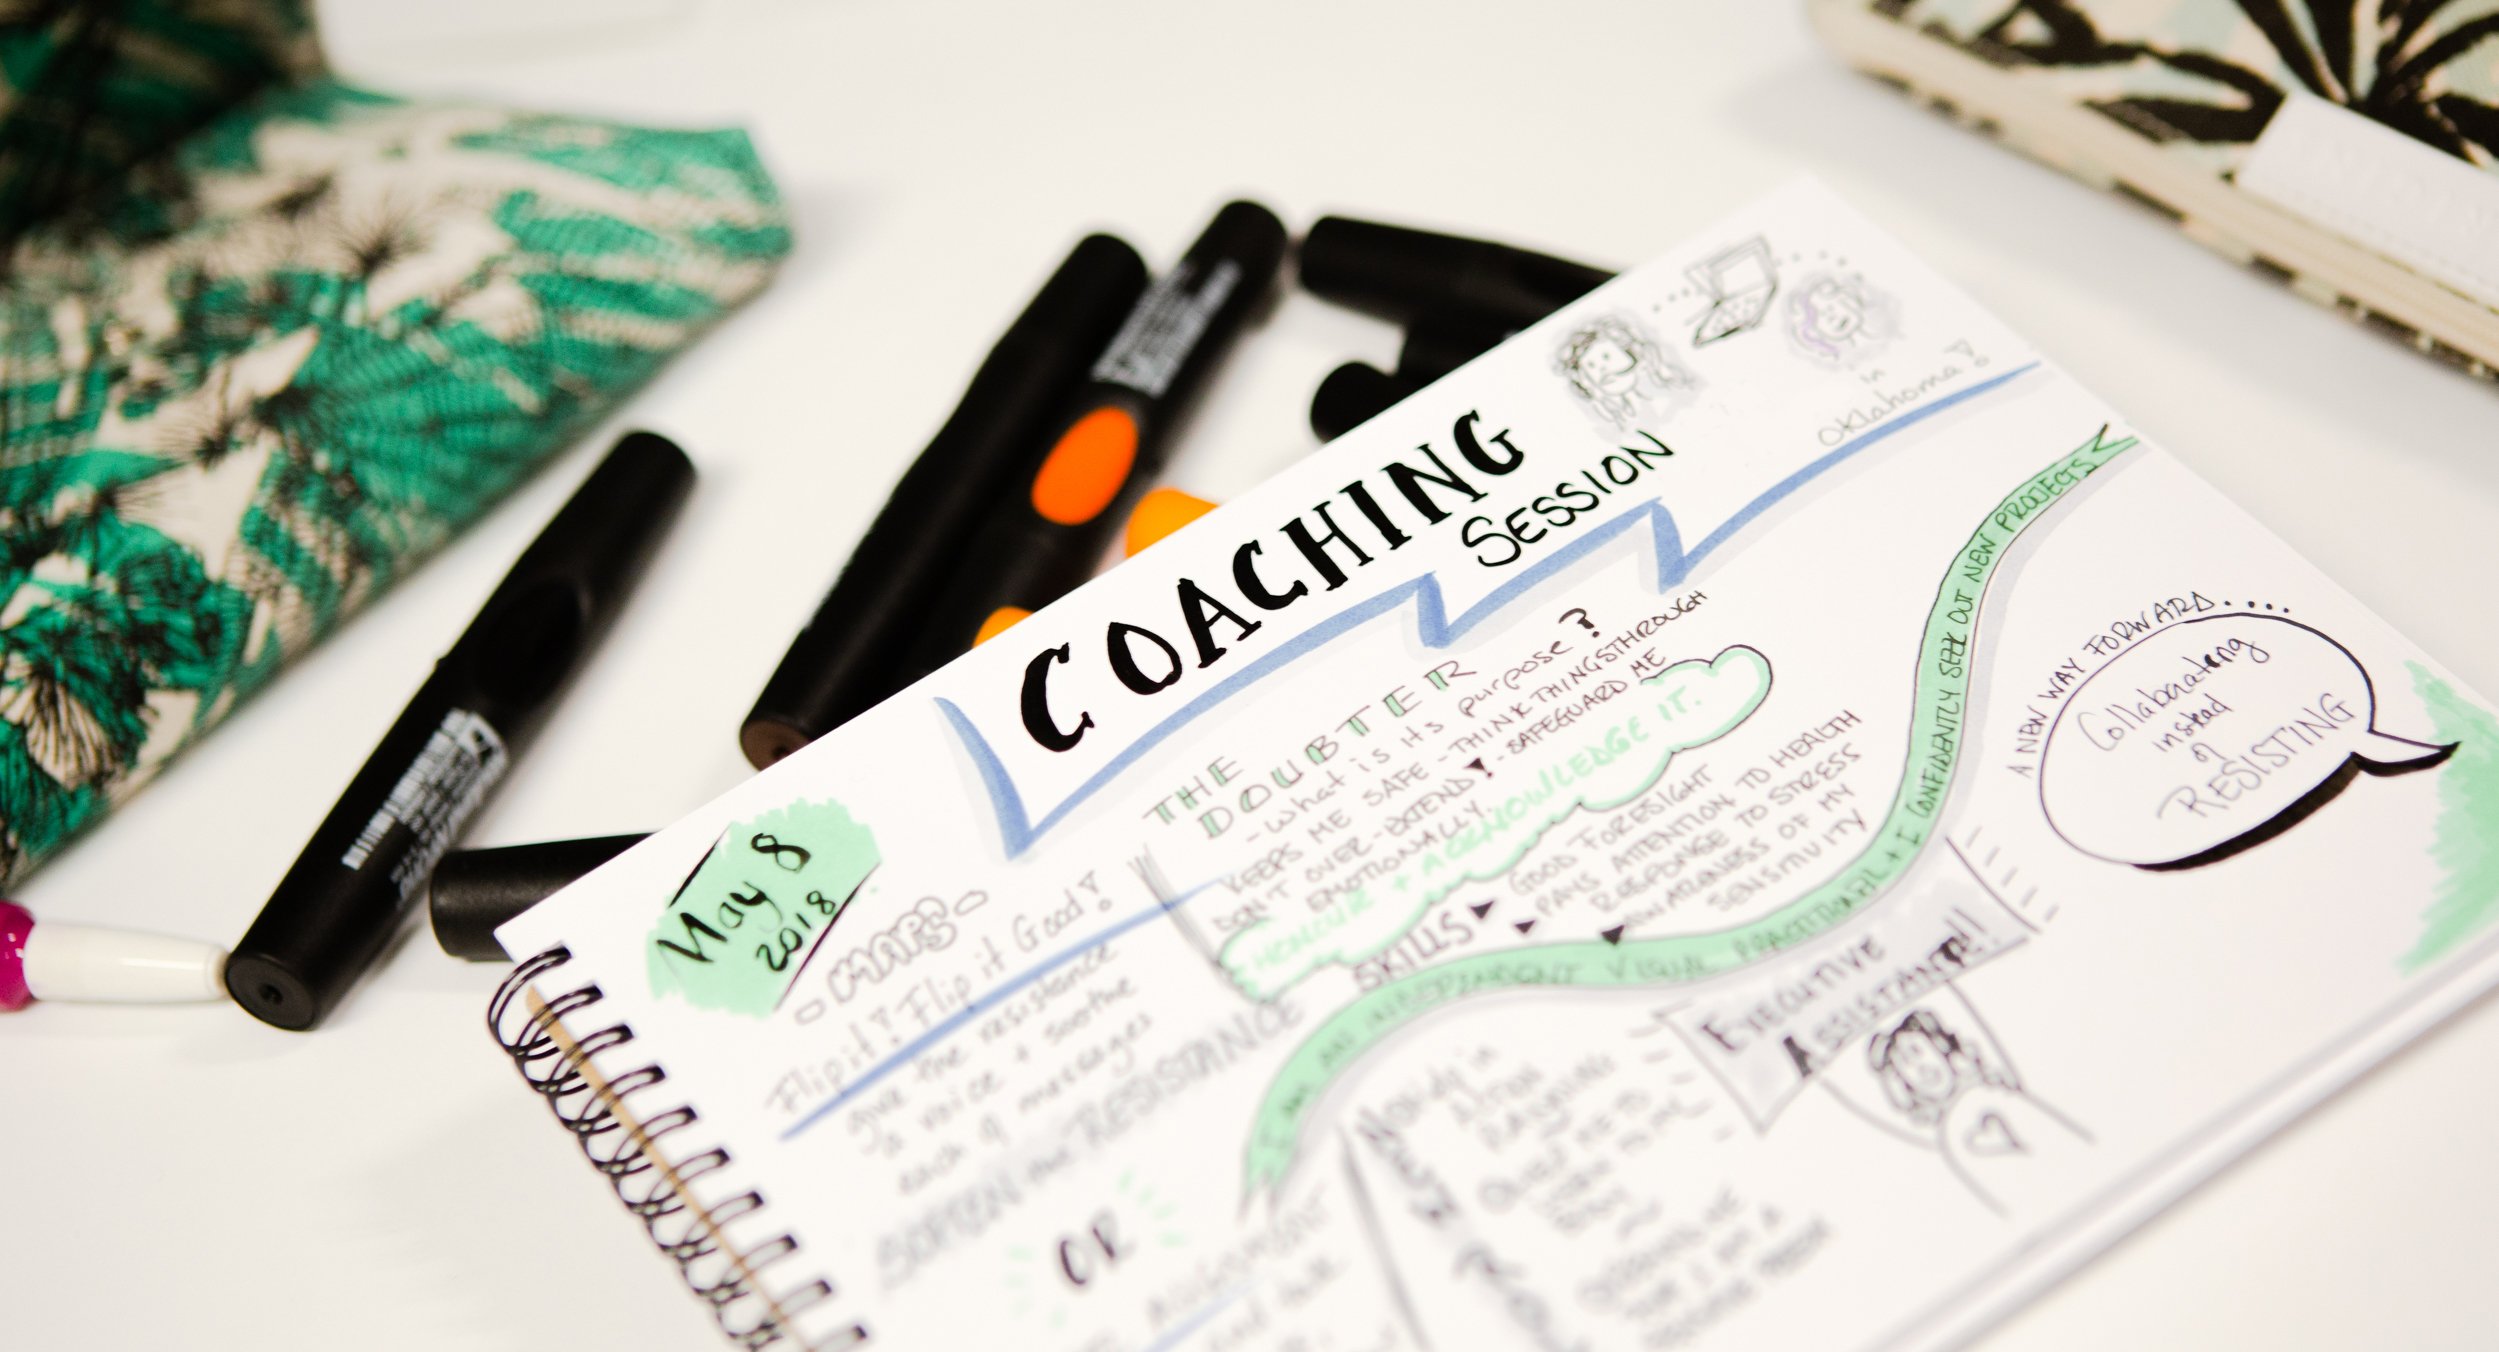
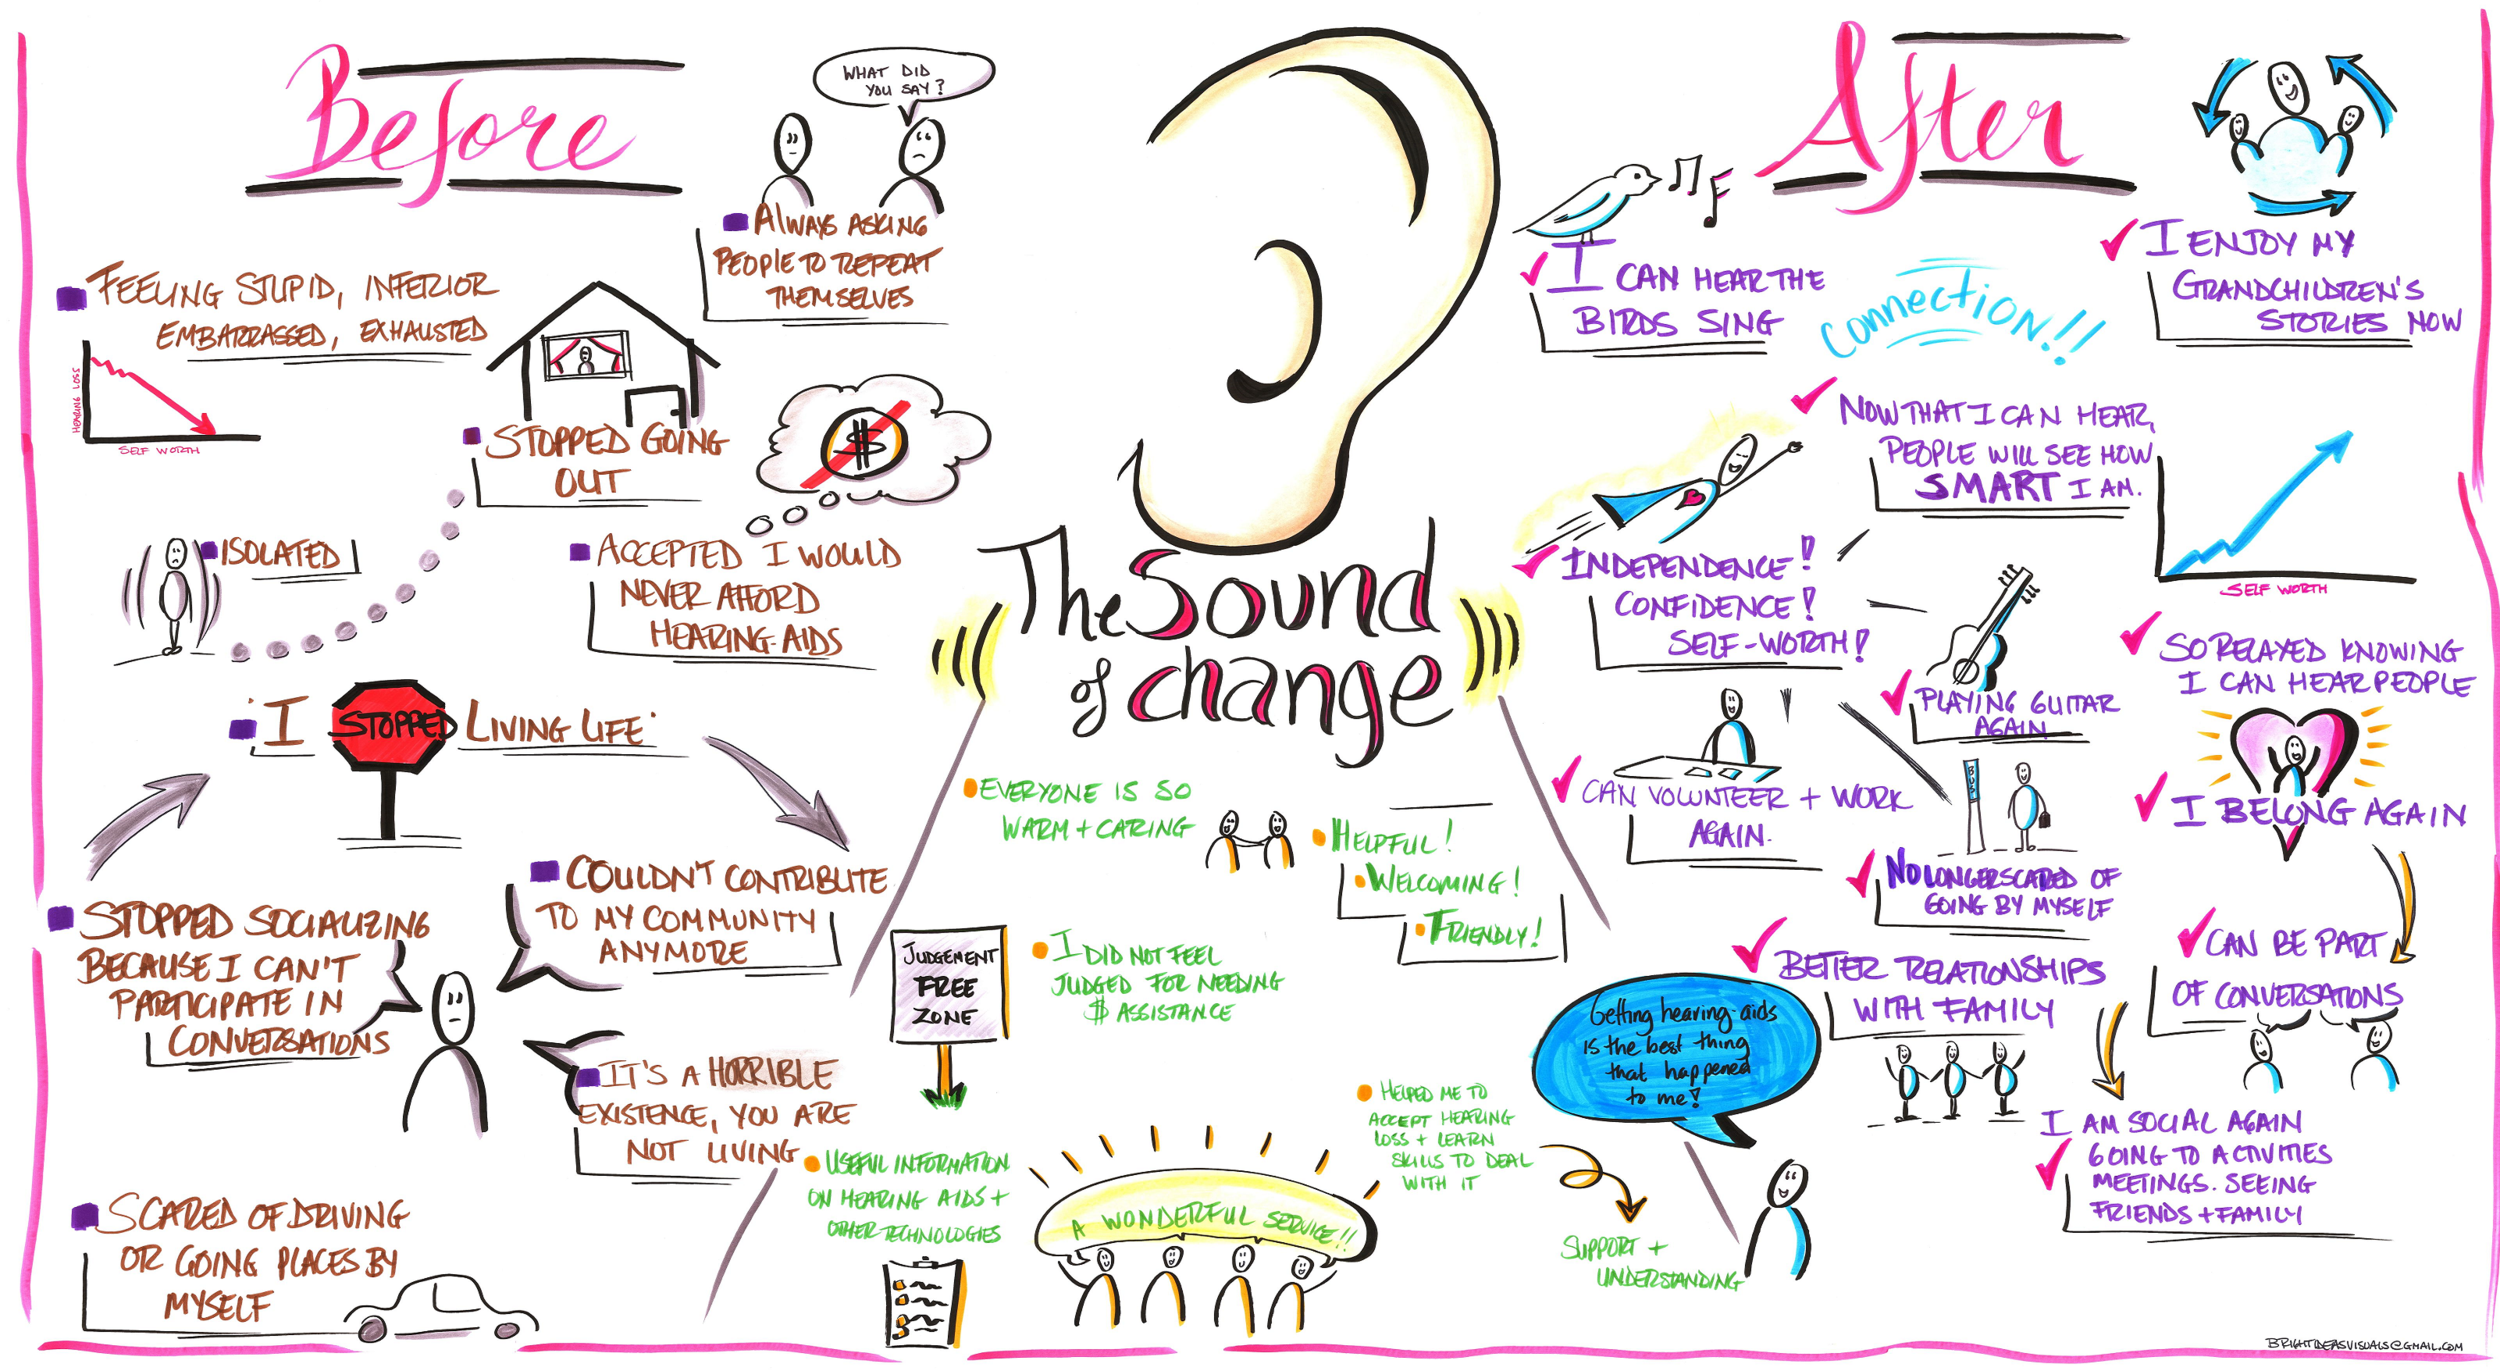
Our visual charts combine eye-catching hand-drawn and computer-generated visuals with text. This engages both the left, logical, analytical side of the brain and the right, creative, emotional, and intuitive side of the brain, allowing people to see how all the moving parts fit together. In a sea of computer generated info-graphics your hand-drawn visual chart will stand out from the rest.
Where are visual charts used?
To communicate a captivating summary and synthesis of the meeting
To translate knowledge and get your research seen and understood
To clearly illustrate a project plan or product process
To map out an individual or team’s journey